
A high BMI rarely disqualifies you from life insurance on its own. It is one input among several that a carrier’s underwriting team runs through a build chart, the same kind of height-and-weight table public health agencies use, and the more likely result is a different rate class, not a flat decline. South Dakota’s own numbers make this a question worth answering plainly: 37.0% of adults in the state had obesity in 2024, according to the CDC’s Behavioral Risk Factor Surveillance System, up from 28.1% in 2011. This guide walks through how BMI and build actually factor into underwriting, what the real South Dakota data shows, and the arithmetic you can do yourself before you ever fill out an application.
The short version
- 37.0% of South Dakota adults had obesity in 2024, and 36.0% did in 2023, according to the CDC's Behavioral Risk Factor Surveillance System (BRFSS), a rise from 28.1% in 2011.
- South Dakota was one of 23 states the CDC classified as having an adult obesity rate of 35% or higher, based on 2023 data reported in its September 12, 2024 news release.
- Nationally, 40.3% of U.S. adults had obesity and 9.4% had severe obesity, according to CDC/NCHS Data Brief No. 508 (September 2024), covering NHANES survey data from August 2021 through August 2023.
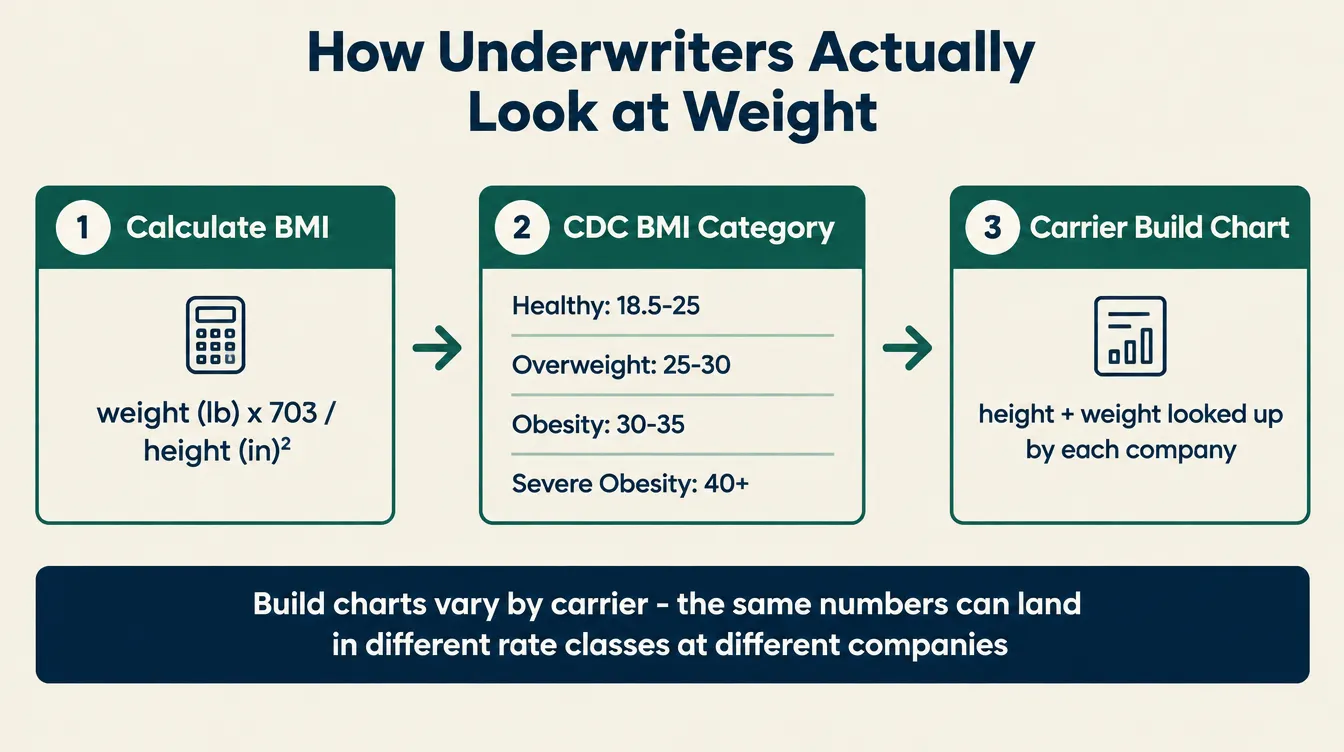
- The CDC defines adult obesity as a BMI of 30 or greater, with Class 3 (severe) obesity starting at a BMI of 40, using the standard BMI calculation of weight in pounds times 703, divided by height in inches squared.
- Every carrier sets its own build chart, so the same height-and-weight combination can land in different rate classes at different companies. This is the single biggest reason to compare more than one carrier rather than treat one company's answer as final.
The pain: assuming your weight already decided the answer
A lot of people who think about buying life insurance and also think about their weight never get past the second thought. They assume the outcome before they ask, and the assumption usually comes from somewhere vague: a story a coworker told, a forum post from years ago, a number they remember hearing that a “healthy” applicant has to be under. So the application never gets started, not because anyone looked at their actual file and said no, but because they decided for the carrier in advance.
The people this affects are not a small group in this state. They are a warehouse supervisor in Rapid City who has carried the same forty extra pounds since his twenties and figures that alone rules him out. They are a mother in Watertown managing type 2 diabetes and a BMI in the mid-30s who assumes both facts stack against her completely. They are a farmer outside Mitchell whose work is physical and whose blood pressure is fine, but who has heard that “obesity” on a chart means an automatic no regardless of anything else. None of these assumptions are irrational. They come from a real pattern: underwriting for weight used to be blunter than it is now, and a lot of the folk knowledge about it never updated.
What actually happens today is more specific and, for a meaningful share of applicants, more forgiving than the assumption. A carrier does not see “obese” as a single yes-or-no gate. It sees a height, a weight, a build-chart lookup, and then everything else in your file, blood pressure, cholesterol, blood sugar, tobacco use, family history, layered on top. Two people at the exact same BMI can get two very different outcomes because everything besides BMI is different between them.
This is general education, not medical or insurance advice
Nothing here diagnoses or treats any condition, and nothing here promises that any specific carrier will approve any specific applicant at any specific rate. It is a plain explanation of how weight and build factor into underwriting, sourced from federal health data and public consumer guidance, so you can see the mechanics clearly before you decide whether to apply.
Why it happens: how BMI and build actually factor into underwriting
Life insurance underwriting is a mortality estimate. A carrier is pricing the statistical likelihood it will pay a death benefit within the life of the policy, and it prices coverage by comparing your risk profile against a large pool of similar applicants. Weight matters to that estimate because sustained excess weight is statistically associated with higher rates of conditions like high blood pressure, type 2 diabetes, and heart disease, the same conditions this blog has covered individually. But weight by itself is a blunt proxy, which is exactly why underwriters do not stop at a single number.
A handful of terms carry the weight of this whole topic, and they are worth defining once since carriers use them without translating them:
- Body Mass Index (BMI) is a simple calculation, weight in pounds times 703, divided by the square of your height in inches, used across medicine and public health as a quick screening measure. It does not distinguish muscle from fat and does not account for where on the body weight is carried, which is part of why it is a starting point for underwriters, not the whole picture.
- Build chart is a carrier’s own table listing the maximum, and sometimes minimum, weight allowed at each height for each rate class it offers. Every carrier writes its own build chart, and companies revise them periodically as their claims experience and actuarial assumptions change.
- Underwriting class (or rate class) is the risk tier a carrier assigns an approved applicant, which sets the premium. Common tiers run from Preferred Plus or Preferred at the top, down through Standard, and then into table-rated classes for higher but still insurable risk.
- Table rating is a step above Standard pricing, used when a build, a health condition, or a combination of factors raises mortality risk above what Standard pricing covers. Table ratings step up in increments, each one adding to the premium above Standard, and the exact increment at each step is set by the individual carrier rather than by any industry-wide standard.
- Paramedical exam is the in-person or telehealth exam many policies require, which typically records your actual height, weight, blood pressure, and a blood and urine sample, rather than relying only on what you wrote on the application.
- Contestability period is the window, typically two years from a policy’s issue date, during which an insurer can investigate a claim and deny it over a material misstatement on the original application. This is why reporting your actual numbers, not a hoped-for version of them, matters regardless of what you expect the underwriting outcome to be.
The mechanical part that surprises most people: build charts are keyed to the height-and-weight pair, not to BMI as a stand-alone figure. A 5-foot-10-inch applicant at 220 pounds and a 6-foot-2-inch applicant at 247 pounds have almost the same BMI, but they are looked up on two completely different rows of a build chart, and either one could land in a different class than the other depending on how that specific carrier’s table is built. That is also why a friend’s outcome, even a friend with what sounds like a similar build, tells you very little about your own.
What it costs to get wrong: the numbers behind the assumption
The reason this topic deserves a straight answer rather than a shrug is scale. This is not a niche question in South Dakota. It is close to the statewide norm.
South Dakota’s obesity rate has climbed steadily for more than a decade, not spiked overnight. The CDC’s Behavioral Risk Factor Surveillance System puts the state’s adult obesity rate at 28.1% in 2011, 29.8% in 2014, 33.0% in 2019, and 37.0% in 2024. In its September 12, 2024 news release covering 2023 data, the CDC placed South Dakota among 23 states with an adult obesity rate of 35% or higher, alongside neighbors like Nebraska and North Dakota.
South Dakota adult obesity rate, selected years
CDC, Behavioral Risk Factor Surveillance System (BRFSS), Nutrition, Physical Activity, and Obesity dataset, accessed September 2026. Figures are self-reported adult obesity prevalence for South Dakota, "Total" stratification, by survey year.
Obesity prevalence in South Dakota is not evenly spread across age groups either, which matters if you are trying to picture where you personally fall.
| Age group | Obesity rate |
|---|---|
| 18 to 24 | 18.2% |
| 25 to 34 | 37.5% |
| 35 to 44 | 46.9% |
| 45 to 54 | 45.7% |
| 55 to 64 | 36.2% |
| 65 or older | 35.6% |
CDC, Behavioral Risk Factor Surveillance System (BRFSS), Nutrition, Physical Activity, and Obesity dataset, 2024 data, accessed September 2026.
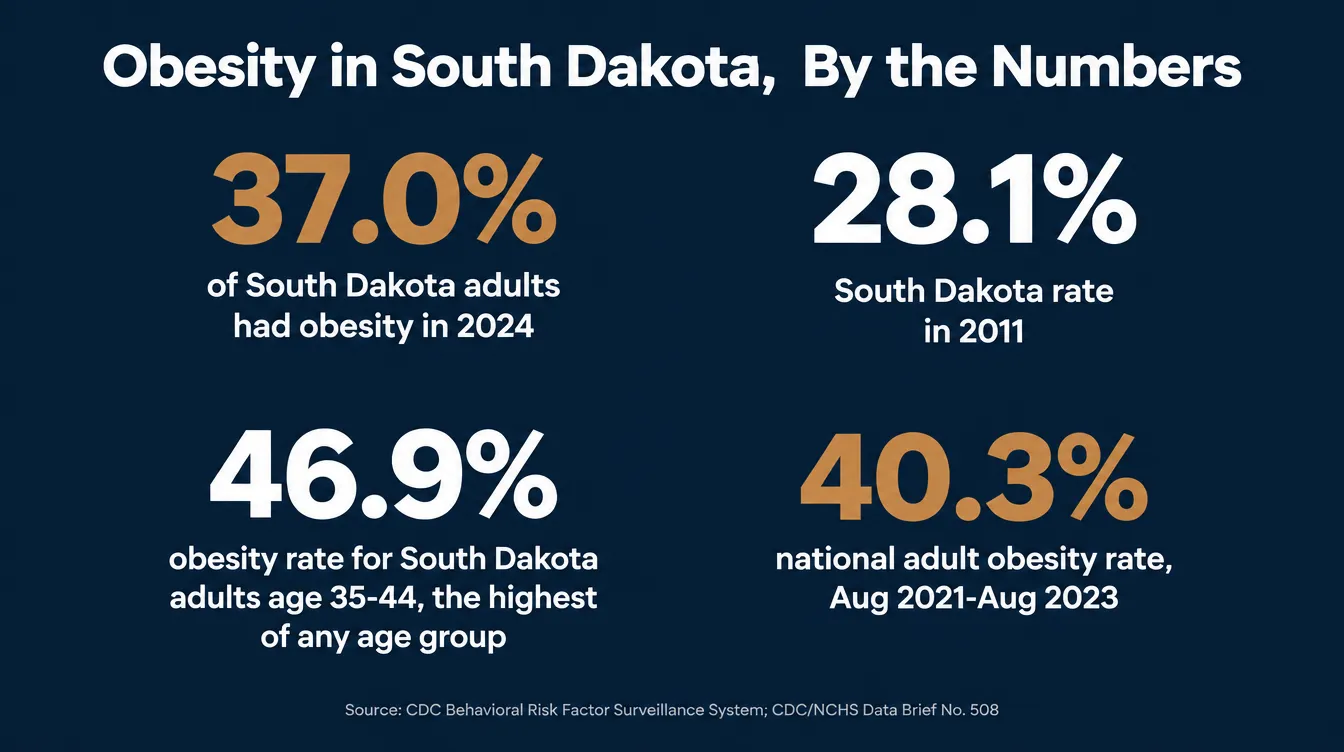
The obesity rate peaks in the 35-to-54 age range in South Dakota, which happens to be exactly the stretch of life when most people are carrying a mortgage, raising kids, and thinking hardest about what would happen to their household if their income disappeared. That overlap is the actual cost of getting this wrong: the group statistically most likely to assume a high BMI rules them out is also the group with the most at stake if they never apply to find out. An assumption that “there’s no point” is very likely wrong for a large share of that group, particularly anyone whose weight is stable and whose related numbers, blood pressure and blood sugar especially, are controlled.
How to work it out yourself: calculate your BMI and know your real starting point
You do not need anyone’s help to get a clear, honest read on where you stand before you talk to a carrier or an agent. This takes about ten minutes.
Step 1: Calculate your BMI using the standard formula. BMI = (weight in pounds × 703) ÷ (height in inches)². If you know your height in feet and inches, convert it to total inches first (a 5-foot-10-inch person is 70 inches).
Step 2: Compare your number against the CDC’s adult BMI categories.
| Category | BMI range |
|---|---|
| Underweight | Less than 18.5 |
| Healthy weight | 18.5 to less than 25 |
| Overweight | 25 to less than 30 |
| Obesity, Class 1 | 30 to less than 35 |
| Obesity, Class 2 | 35 to less than 40 |
| Obesity, Class 3 (severe) | 40 or greater |
CDC, Adult BMI Categories, accessed September 2026.
Step 3: Remember that this category is a health classification, not an insurance verdict. Carriers look up your actual height and weight on their own build chart, which does not track the CDC categories exactly, and then weigh everything else in your file alongside it.
Step 4: Gather your related numbers. Your most recent blood pressure and cholesterol readings, whether you have a diagnosis like type 2 diabetes or sleep apnea and whether it is controlled, and your tobacco use all sit next to BMI in an underwriter’s full picture. A high BMI paired with well-controlled blood pressure and no other conditions reads very differently than the same BMI paired with several uncontrolled conditions.
Step 5: Do the math on two hypothetical people to see how build, not just BMI, changes the picture.
| Applicant | Height | Weight | BMI | CDC category |
|---|---|---|---|---|
| Applicant A | 5'10" (70 in) | 220 lb | 31.6 | Obesity, Class 1 |
| Applicant B | 5'4" (64 in) | 150 lb | 25.7 | Overweight |
Illustrative calculations using the standard BMI formula (weight in pounds × 703 ÷ height in inches²) and CDC adult BMI categories. Not an underwriting outcome or a quote.
Applicant A’s BMI of 31.6 puts them in the CDC’s Obesity Class 1 category. That number alone does not decide their underwriting class. What decides it is where that specific height-and-weight pairing falls on a given carrier’s build chart, combined with their blood pressure, cholesterol, blood sugar, and tobacco status. The same applicant could land in a Standard class at one carrier and a table-rated class at another, because build charts genuinely differ by company. This is not a loophole, it is simply how the industry is structured, and it is the exact reason comparing carriers matters more here than almost anywhere else in underwriting.
You can gather all of this yourself first
Steps 1 through 4 just require a scale, a tape measure, and whatever your doctor's office already has on file for your blood pressure and cholesterol. Where a second opinion tends to help most is comparing how different carriers' build charts actually treat the same height-and-weight pairing, since that comparison is very hard to do alone from outside the industry.
If you would rather have someone local go through that comparison with you, that is what we do: Compare My Options.
The mistake isn't applying and getting a difficult answer. It's assuming the answer and never finding out what it actually is.
Mike Moore, Life Insurance AdvisorWhy South Dakota shopping matters here specifically
The Life Insurance Buyer’s Guide published by the National Association of Insurance Commissioners (NAIC), the organization that coordinates state insurance regulators nationally, puts it plainly for consumers: life insurance is a competitive marketplace, and shoppers should compare similar policies across more than one company rather than treat a single quote as the answer. That guidance was written for general shopping, but it applies with extra force to a build-chart situation, where the same file can produce genuinely different outcomes at different companies.
If you ever have a concern about how an application was handled, South Dakota’s Division of Insurance, the state agency that licenses and regulates every carrier authorized to sell here, maintains a public complaint process and a consumer information line at (605) 773-3563. You can also verify that any company you are considering is actually licensed to sell in South Dakota through the division’s own listings before you apply.
How we help
We are independent, so we are not tied to one carrier’s build chart. We start with your actual height, weight, and health history, not a guess about what a single company will say, and compare how the carriers we work with treat a file like yours. Build charts vary enough by company that this comparison is the single highest-leverage thing an independent agency can do for someone in this exact situation, more than for almost any other underwriting factor we cover on this blog. We are local to Sioux Falls and licensed to serve all of South Dakota, so the person doing that comparison is someone you can actually talk to, not a call center reading from a script.
What you get
A clear, honest read on how your actual build and health numbers compare against what several carriers are looking for right now, not a decades-old assumption about what “obesity” means for an application. A comparison across more than one carrier’s build chart, instead of a single company’s answer treated as universal. And a plain explanation, in advance, of what South Dakota’s own consumer protections and complaint process look like if you ever need them.
Find out what your options actually look like
We will go through your build, your health numbers, and what you need to protect, and show you how the carriers we work with actually evaluate a file like yours.
Not ready to talk to anyone yet? Read How It Works first and come back when you are.
You can also run the BMI arithmetic above yourself in about five minutes. Most people find that the part actually worth a second opinion is comparing how different carriers treat the same numbers, not the calculation itself.
Frequently asked questions
Can you get life insurance if you’re overweight or have a high BMI?
In most cases, yes. A high BMI by itself rarely produces an automatic decline. It usually moves you out of a carrier’s top rate class and into a Standard or table-rated class, which raises the premium but still results in a policy. Whether you qualify for a better class, a rated class, or face a decline at a specific carrier depends on your full build (height, weight, and often waist measurement), blood pressure, cholesterol, blood sugar, and the rest of your medical history, not BMI alone.
What BMI is too high for life insurance?
There is no single cutoff that applies everywhere, because every carrier writes its own build chart and each chart sets different weight limits at every height. The CDC’s own adult BMI categories, 30 and above for obesity and 40 and above for Class 3 (severe) obesity, are a health classification, not an insurance rule. A BMI in the low 30s often still reaches a Standard or better class at many carriers; a BMI in the 40s or higher is more likely to draw a table rating or, at some carriers, a decline, though outcomes vary enough by company that the only way to know your specific number is to apply.
How do life insurance companies calculate BMI and build?
Underwriters use the same formula public health agencies use: weight in pounds, multiplied by 703, divided by height in inches squared. They plug that number, plus your actual height and weight, into the carrier’s own build chart, a table that lists a maximum (and sometimes minimum) weight allowed for each height at each rate class. Two people with an identical BMI but different heights and weights can land in different classes, because build charts are based on the height-and-weight pairing, not BMI as a single number.
Will every carrier rate my application the same way?
No, and this is the single biggest thing to understand before you assume an outcome. Build charts differ by carrier, and they change over time as each company updates its own underwriting guidelines. A height-and-weight combination that draws a table rating at one carrier can land in a Standard or even a Preferred class at another. This is exactly why comparing more than one carrier, instead of accepting one company’s answer as universal, matters more here than for almost any other underwriting factor.
How common is obesity in South Dakota?
37.0% of South Dakota adults had obesity in 2024, and 36.8% did in 2023, according to the CDC’s Behavioral Risk Factor Surveillance System (BRFSS). That is up from 28.1% in 2011 and puts South Dakota among the 23 states the CDC classified as having an adult obesity rate of 35% or higher in its September 2024 report. Nationally, 40.3% of U.S. adults had obesity as of the CDC’s most recent National Health and Nutrition Examination Survey (NHANES) data, covering August 2021 through August 2023.
What can I do to improve my chances before applying?
Gather your actual numbers first: your current height and weight, your most recent blood pressure and cholesterol readings if you have them, and whether any related condition (like high blood pressure or type 2 diabetes) is diagnosed and controlled. A stable, controlled picture generally underwrites better than an unstable or undocumented one, even at the same BMI. Beyond that, the honest answer is that comparing carriers, not changing your weight before you apply, is the step most people skip and the one most likely to change your outcome.
Do I have to disclose my weight on a life insurance application?
Yes. Height and weight are standard questions on essentially every life insurance application, and many policies include a paramedical exam that measures both directly rather than relying on your stated numbers. Most policies also carry a contestability period, typically two years, during which an insurer can investigate and deny a claim over a material misstatement, so reporting your actual numbers matters more than guessing which answer sounds better.
Before you apply
This article is general education, not insurance, legal, financial, medical, or tax advice. Product availability, features, underwriting criteria, and rates vary by carrier and are subject to underwriting; a specific outcome for any individual applicant cannot be predicted or guaranteed. No coverage exists until a policy is issued and in force. Any guarantees are subject to the claims-paying ability of the issuing insurer. Please speak with a licensed agent and your health care provider about your specific situation.
Sources
- CDC, Behavioral Risk Factor Surveillance System (BRFSS) — Nutrition, Physical Activity, and Obesity dataset — accessed September 2026; South Dakota adult obesity prevalence by year (28.1% in 2011 through 37.0% in 2024) and by age group (2024)
- CDC Newsroom — “New CDC Data Show Adult Obesity Prevalence Remains High” — published September 12, 2024; South Dakota among 23 states with 2023 adult obesity prevalence of 35% or higher
- CDC, National Center for Health Statistics — “Obesity and Severe Obesity Prevalence in Adults: United States, August 2021–August 2023,” NCHS Data Brief No. 508 — published September 2024; national adult obesity prevalence 40.3%, severe obesity 9.4%
- CDC — Adult BMI Categories — accessed September 2026; standard BMI classification ranges
- National Association of Insurance Commissioners — Tips for Buying Life Insurance — accessed September 2026; consumer guidance on comparison shopping and verifying carriers
- South Dakota Division of Insurance — Consumer Information — accessed September 2026; complaint process and consumer contact information
Related reading: Getting Life Insurance After a Health Condition: 2026 Underwriting Trends, Life Insurance With High Blood Pressure: A 2026 SD Guide, and Underwritten vs. No-Exam Life Insurance: Price vs. Convenience in 2026. See our page for people with health conditions, current options for term life, or learn more about how it works.