
If you’re asking whether your retirement savings will last, the honest answer is: it depends on a handful of numbers you can actually calculate, not on a feeling. Research from the Employee Benefit Research Institute (EBRI), tracking real households from 1992 through 2022, found that about a third of retirees still have 100% or more of their starting assets by their mid-80s. It also found that roughly a fifth of retirees who started with $500,000 or more had less than 20% of it left by the same age. Both of those are normal outcomes. Which one you’re headed toward comes down to your withdrawal rate, your guaranteed income, and how you handle the first few years of retirement, all of which you can work out before it becomes a guess.
The short version
- Morningstar's 2026 research puts the safe starting withdrawal rate for a new retiree at 3.9% of savings, up from 3.7% in 2025, assuming a 30-year retirement and a 90% chance of not running out.
- EBRI research covering 1992–2022 found about a third of retirees still hold all their starting assets by their mid-80s, while roughly a fifth of $500,000-plus retirees had less than 20% left by the same age. It isn't one universal outcome.
- The riskiest years for a retirement portfolio are often the first five, when a bad market combined with withdrawals can permanently shrink what's left, a pattern called sequence-of-returns risk.
- An income annuity converts part of your savings into a paycheck that doesn't depend on markets or your own withdrawal math, backed by the issuing insurer's claims-paying ability.
- U.S. retail annuity sales hit a record $464.1 billion in 2025, per LIMRA, the fourth straight record year, as more retirees look for guaranteed income alongside Social Security.
The pain: you saved for decades, and now nobody tells you how to spend it
For thirty or forty years, the instructions were simple: contribute to the 401(k), don’t touch it, let it grow. Then you retire, and the instructions stop. Nobody hands you a monthly withdrawal number. Your account statement still shows a balance, but the balance doesn’t tell you what’s safe to spend this year, next year, or in fifteen years when the market has had two or three bad stretches you can’t predict from here.
This is a different kind of problem than saving was. During your working years, a market drop was almost always fine, because you had years of future paychecks to keep contributing and time for the market to recover before you needed the money. In retirement, you’re not adding money anymore. You’re taking it out, on a schedule you set, whether the market that month is up or down. That single change, from adding to withdrawing, is why “how much can I safely spend” is a genuinely harder question than “how much should I save,” even though it gets far less attention.
The fear that shows up instead is usually one of two extremes. Either you spend cautiously and end up sitting on a pile of money you were too afraid to use, which the EBRI data above shows is common, or you underestimate how long the money needs to last and run short in your 80s, when going back to work isn’t a realistic option. Neither is a plan. Both are what happens by default when nobody works through the arithmetic with you.
This is general education, not a recommendation
Nothing in this article is a recommendation to buy a specific product, withdraw at a specific rate, or take a specific action with your own accounts. It's the framework and the sourced numbers behind that framework, so you can do the first pass of this math yourself or bring it to someone to check.
Why it’s hard: three risks with names, not just “the market might drop”
Three separate risks combine to make retirement income harder than accumulation. Naming them makes each one easier to plan around.
Longevity risk is simply the risk of living longer than your money lasts. It sounds obvious, but most people badly misjudge their own number. According to the Social Security Administration’s period life table, using 2023 mortality data as applied in the 2026 Trustees Report, a man who reaches age 65 has a remaining life expectancy of 18.12 years, and a woman who reaches 65 has a remaining life expectancy of 20.66 years. Those are averages. Half of 65-year-olds will live longer than that, some by a decade or more, and a plan built around “the average” leaves half the population short.
Sequence-of-returns risk is the risk that a bad market shows up early in retirement rather than late. Two retirees can earn the exact same average annual return over 25 years and end up in completely different places, because one of them was forced to sell shares at a loss to cover living expenses during a downturn in year two, permanently shrinking the base that has to recover, while the other’s downturn landed in year twenty, after decades of growth had already built a cushion. The order returns happen in matters as much as the average return itself, and you don’t get to choose which order you get.
Inflation risk is the risk that a fixed income stream buys less every year it stays fixed. A monthly payment that feels comfortable at 65 can feel tight at 80 if it never adjusts, which is part of why Social Security’s annual cost-of-living adjustment (COLA) matters more than people assume: the Social Security Administration set the 2026 COLA at 2.8%, raising the average monthly retired-worker benefit from $2,015 to $2,071. A private pension or a level annuity payment usually does not include an automatic adjustment like that unless you specifically buy one, which is a real tradeoff to understand before you commit.
A few more terms come up constantly in this conversation, so it’s worth defining them once, plainly:
- Safe withdrawal rate is the percentage of your starting portfolio you can withdraw in year one, then adjust for inflation each year after, with a reasonably high probability the money outlasts a set time horizon.
- Required minimum distribution (RMD) is the minimum amount the IRS requires you to withdraw each year from most tax-deferred retirement accounts, starting at a set age, whether or not you actually need the money that year.
- Annuitization is the act of converting a lump sum into a stream of periodic payments, usually for life, through an insurance contract.
- Surrender charge is a penalty an annuity contract charges if you withdraw more than an allowed amount during a set number of years after purchase, typically declining to zero over that period.
- Participation rate and cap rate are the two most common ways a fixed indexed annuity limits how much index gain you’re credited with in a good year, in exchange for protecting your principal in a bad one.
- MYGA (multi-year guaranteed annuity) is a fixed annuity that locks in a stated interest rate for a set number of years.
What it costs to get the number wrong
The gap between “safe” and “not quite safe enough” is smaller than most people assume, and it moves every year based on real research, not a rule of thumb frozen in time.
| Year of research | Base-case safe withdrawal rate |
|---|---|
| 2021 | 3.3% |
| 2022 | 3.8% |
| 2023 | 4.0% |
| 2025 | 3.7% |
| 2026 | 3.9% |
Morningstar, "What's a Safe Retirement Withdrawal Rate for 2026?", published Dec. 3, 2025. Base-case figures assume a new retiree, a 30-year horizon, a 90% probability of not running out, and a 30%–50% equity allocation, excluding Social Security or other non-portfolio income. Years without a published base-case figure in the cited report are omitted.
Morningstar's base-case safe withdrawal rate, 2021–2026
Morningstar, "What's a Safe Retirement Withdrawal Rate for 2026?", published Dec. 3, 2025. Illustrative, not a projection for any individual account.
Run the difference on real dollars. A retiree starting with a $600,000 portfolio at the 2023 base-case rate of 4.0% could plan on about $24,000 in year one. The same $600,000 at the 2026 base-case rate of 3.9% supports about $23,400, a difference of $600 a year, or $50 a month, from a change in the underlying research alone, before any change in your own portfolio or spending. That’s not a large swing, but it illustrates the point: “the 4% rule” was never a permanent constant, and treating it as one, rather than checking current research every few years, is exactly how a retiree ends up either overspending against outdated assumptions or underspending against overly conservative ones.
The other side of getting it wrong shows up in the EBRI research cited above. Both outcomes it documents are real. A third of retirees still hold everything they started with by their mid-80s, and a meaningful share of $500,000-plus retirees had less than a fifth of their assets left by the same age. Morningstar’s research points to a specific cause for the second group: retirees who experienced poor market returns in the first five years of retirement and didn’t adjust their spending downward were substantially more likely to run through their savings than those whose first five years happened to be positive. Sequence-of-returns risk isn’t theoretical. It’s the single biggest factor separating the two outcomes in that EBRI data.
How to work it out yourself: the four-step method
None of this requires hiring anyone to get a first, honest estimate. It requires your account statements, your Social Security estimate, and about twenty minutes.
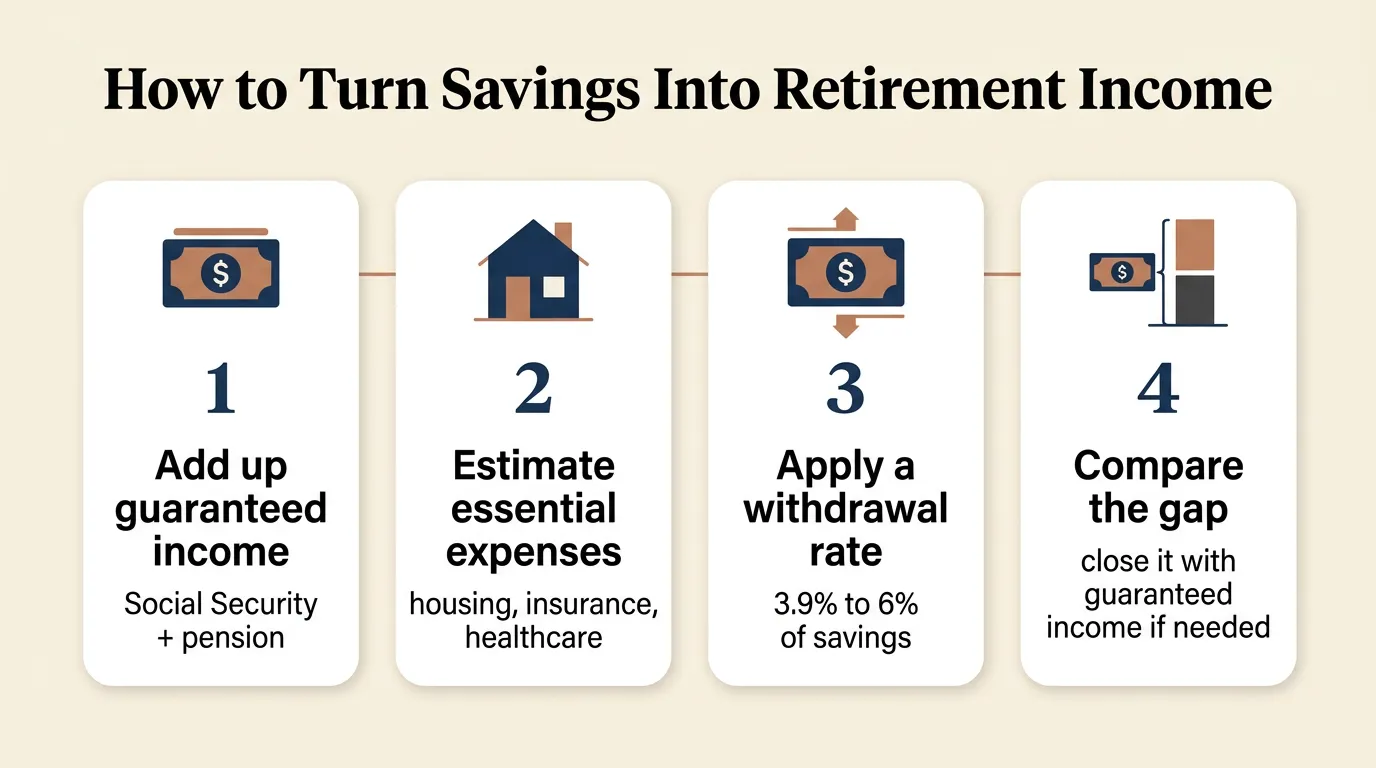
- Add up your guaranteed income. Pull your Social Security benefit estimate (available at ssa.gov) and any pension you’re owed. This is money that arrives regardless of what markets do, and it’s the floor everything else gets built on.
- Estimate your essential annual expenses, separate from discretionary spending. Housing, insurance, utilities, groceries, and healthcare go in the essential column. Travel, gifts, and hobbies go in a separate, more flexible column. This split matters because the next step treats the two differently.
- Apply a withdrawal-rate range to your investable savings, not a single number. Multiply your portfolio balance by roughly 3.9% for a conservative, “don’t have to think about it again” starting point, or by a figure closer to 6% if you’re genuinely willing to cut discretionary spending in a down year, per Morningstar’s 2026 research on flexible withdrawal strategies. That range gives you a realistic band of what your savings alone can support, not a false-precision single number.
- Compare the gap. If your guaranteed income from step 1 already covers your essential expenses from step 2, your portfolio withdrawals are mostly funding the discretionary column, which is a comfortable place to be. If there’s a gap between guaranteed income and essential expenses, that gap is exactly the kind of thing an income annuity is built to close, converting part of your portfolio into a second, more predictable income floor rather than leaving essential bills dependent on market-timed withdrawals.
You can run this yourself first
Steps 1 through 3 take about twenty minutes with a Social Security estimate and a calculator. Where a second opinion tends to earn its keep is step 4, deciding how much of any gap to close with guaranteed income versus flexible withdrawals, and in comparing what different carriers actually offer if you decide an annuity makes sense for part of your savings.
A worked example
Take a couple near Sioux Falls, ages 66 and 64, with $420,000 in combined retirement savings across IRAs and a 401(k). Between them, their Social Security benefits total $3,100 a month, or $37,200 a year, using figures in the range of the SSA’s 2026 average retired-worker benefit of $2,071 per person after the 2.8% COLA. They estimate essential annual expenses, housing, insurance, utilities, groceries, and healthcare, at $52,000, with another $14,000 a year they’d like available for travel and discretionary spending.
| Item | Annual amount |
|---|---|
| Combined Social Security income | $37,200 |
| Essential expenses (housing, insurance, utilities, groceries, healthcare) | $52,000 |
| Gap between guaranteed income and essential expenses | $14,800 |
| Portfolio withdrawal at 3.9% of $420,000 (Morningstar's 2026 base case) | $16,380 |
| Desired discretionary spending | $14,000 |
Illustrative example only. Withdrawal figure applies Morningstar's 2026 base-case rate to a hypothetical $420,000 balance; not a projection for any specific account or a recommendation.
At a 3.9% withdrawal rate, this portfolio supports about $16,380 in year one, which covers the $14,800 gap between Social Security and essential expenses with about $1,580 left toward the $14,000 discretionary goal, still short by roughly $12,400 a year. The couple has choices here, not a forced answer: draw down the portfolio faster and accept more sequence-of-returns risk, scale back discretionary spending in years the market is down (the flexible approach Morningstar’s research supports), or annuitize a portion of the $420,000, say $100,000, into an income annuity that could close some or all of the essential-expense gap with a payment that doesn’t depend on markets, leaving the remaining balance invested for growth and discretionary flexibility. None of these is automatically correct. The point of the exercise is that the couple can see the actual numbers and choose deliberately, instead of guessing.
Where annuities fit, and where they don’t
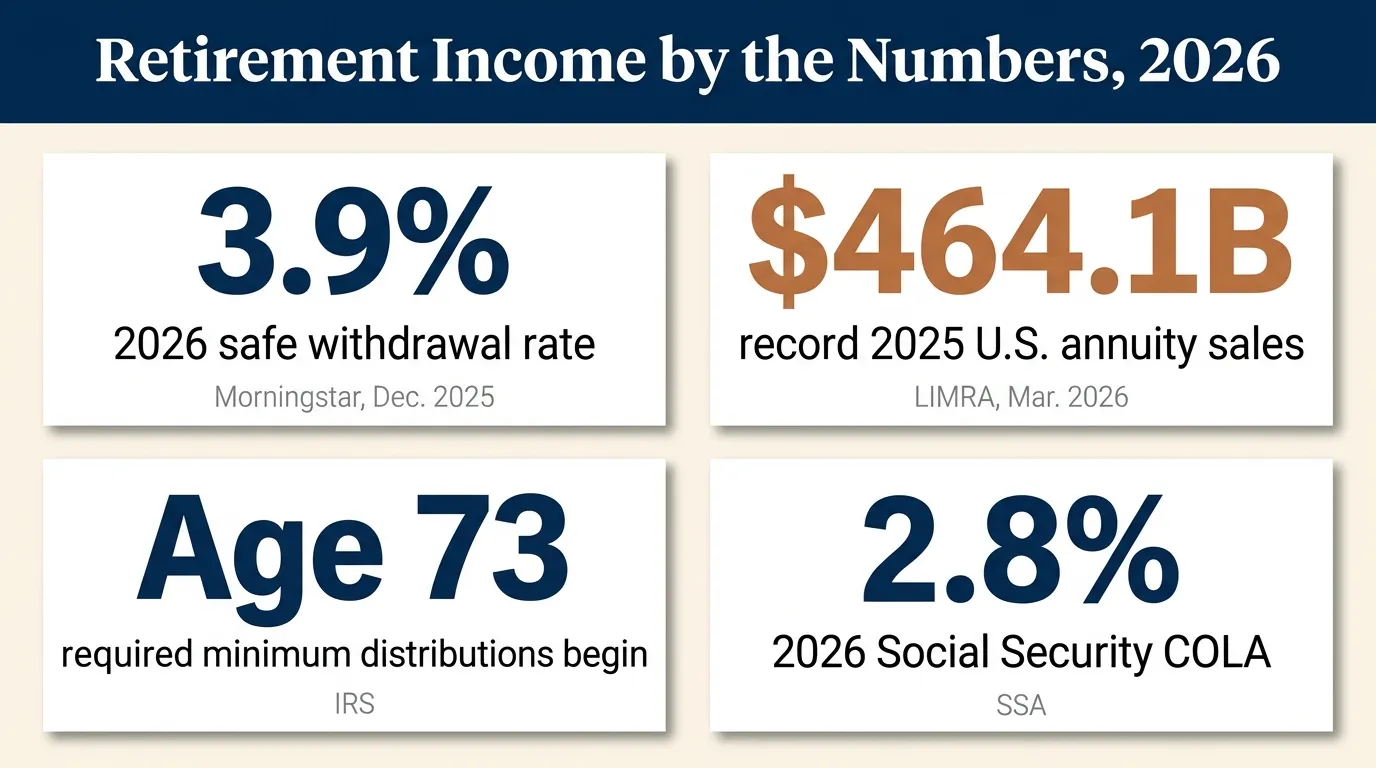
U.S. retail annuity sales hit a record $464.1 billion in 2025, a 7% increase over 2024 and the fourth consecutive record year, according to LIMRA’s final industry survey, which represents 93% of the U.S. annuity market. Fixed-rate deferred annuities led with $165.3 billion in sales, fixed indexed annuities followed at $127.9 billion, and combined immediate and deferred income annuities added $19.2 billion. That volume reflects a real shift: more retirees are choosing to convert part of their savings into contractual income rather than managing every withdrawal themselves, particularly as they weigh longevity and sequence-of-returns risk against a portfolio-only approach.
Morningstar’s own 2026 research reaches a similar conclusion from the withdrawal-rate side: the report notes that decisions to enlarge guaranteed income, whether by delaying Social Security or adding an annuity, pair well with more flexible portfolio withdrawal strategies, because a larger guaranteed-income floor gives a retiree more room to let portfolio spending flex up and down with the market rather than needing every withdrawal to be conservative. The tradeoff the same research is clear about: enlarging guaranteed income generally reduces what’s left over for heirs, since money annuitized is money that’s no longer part of your liquid estate.
There isn’t one kind of annuity, and the four types worth knowing overlap with what we work with directly:
Fixed annuity
Credits a set interest rate declared by the insurer, with no market exposure. The simplest structure to understand, and the most predictable.
Fixed indexed annuity
Credits interest based partly on an index's performance, subject to a cap or participation rate, with principal protected by a floor, often 0%. Not a direct market investment.
Immediate income annuity
Converts a lump sum into income payments that begin within about a year, suited to someone who needs the paycheck to start now.
Multi-year guaranteed annuity (MYGA)
A fixed annuity that locks a stated rate for a set number of years, comparable in structure to a CD, but issued by an insurer and typically tax-deferred.
What you keep and give up
- Full liquidity; the whole balance stays accessible
- Full upside if markets perform well
- You bear sequence-of-returns and longevity risk directly
- You have to recalculate a safe rate as conditions change
- Remaining balance passes to heirs
What you keep and give up
- A contractual income stream backed by the insurer's claims-paying ability
- No sequence-of-returns risk on the annuitized portion
- Reduced or no liquidity on the amount annuitized, often with surrender charges
- Upside is limited (fixed) or capped (indexed), not open market exposure
- Less left for heirs from the annuitized portion, depending on the payout option chosen
What this article is not saying
A fixed indexed annuity is not a market investment, and any upside is limited by a cap rate or participation rate the insurer sets. Any guarantee in an annuity contract, fixed or indexed, is only as strong as the issuing insurer's claims-paying ability. Surrender charges typically apply if you withdraw more than an allowed amount during the surrender period, which can run several years. This article does not recommend annuitizing any specific amount, and an annuity is the wrong tool for money you may need in full, on short notice.
An annuity doesn't make your retirement bigger. It makes part of it predictable. Whether that trade is worth it depends on how much of your essential spending is already covered by something else.
Mike Moore, Life Insurance AdvisorThe South Dakota rule that governs how annuities can be sold here
South Dakota’s Division of Insurance requires producers recommending an annuity to meet a “best interest” standard built around four obligations: care (understanding your financial situation and having a reasonable basis for the recommendation), disclosure (explaining the recommendation, the producer’s role, and compensation), managing conflicts of interest, and documentation. The standard took effect January 1, 2023, and applies to every resident and non-resident producer selling annuities in the state. If a producer pressures you, skips the disclosure form, or can’t explain why a specific annuity fits your situation, that’s worth raising directly with the South Dakota Division of Insurance.
How we help
We’re independent, so we’re not tied to one insurer’s annuity or one company’s version of “guaranteed income.” We work through your Social Security timing, your essential expenses, and your actual portfolio balance the way the worked example above does, then compare fixed, fixed indexed, immediate income, and MYGA options across the carriers we represent to see what, if anything, genuinely closes a real gap in your income plan. Just as often, the honest answer is that your existing Social Security and portfolio already cover what you need, and an annuity isn’t the right tool for your situation. We’ll tell you that too.
What you get
A clear picture of your guaranteed income versus your essential expenses, in real numbers, not a rule of thumb. An honest look at whether annuitizing part of your savings closes a real gap or just adds a product you don’t need. And if an annuity does fit, a comparison across carriers instead of a single company’s pitch, so the surrender terms, the rate, and the insurer’s strength are all decisions you made with full information.
Work through your own retirement income numbers
We'll go through your Social Security timing, your essential expenses, and your savings together, and show you where fixed, indexed, immediate, and MYGA annuities do and don't fit your situation.
Frequently asked questions
Will my retirement savings actually last?
There’s no single answer, but there is a way to check. Total your guaranteed income (Social Security plus any pension), estimate your essential yearly expenses, and apply a safe withdrawal rate to your remaining portfolio to see what it can realistically support. Research from EBRI covering 1992 to 2022 found that about a third of retirees still have all of their starting assets, or more, by their mid-80s, but roughly a fifth of retirees who started with $500,000 or more had less than 20 percent of it left by the same age. Both outcomes are common. The math tells you which side of that line you’re closer to.
What is a safe withdrawal rate for 2026?
Morningstar’s 2026 research puts the base-case safe starting withdrawal rate at 3.9% of a portfolio for a new retiree planning a 30-year retirement with a 90% probability of not running out, assuming an equity allocation of 30% to 50%. That’s up from 3.7% in last year’s report. Retirees willing to adjust spending in response to market conditions, a flexible or “guardrails” approach, may be able to start closer to 6%. Neither number accounts for your specific expenses, other income, or tax situation.
How does an annuity turn savings into guaranteed income?
You move a lump sum to an insurance company, and in exchange the insurer contractually promises to pay you an income stream, often for as long as you live, backed by its claims-paying ability. An immediate income annuity starts payments right away; a deferred income annuity starts them at a future date you choose, typically producing a larger payment per dollar because the insurer has longer to hold your money first. Either way, you’re trading a lump sum of savings for a predictable paycheck that doesn’t depend on how markets perform or on you calculating a withdrawal rate correctly.
What’s the difference between an immediate income annuity and a deferred income annuity?
Timing. An immediate income annuity (SPIA) begins paying out within about a year of purchase, which suits someone who needs income now. A deferred income annuity (DIA) starts payments at a future date you select, sometimes a decade or more out, and because the insurer holds the money longer before paying claims, the eventual payment per dollar deposited is typically larger. Both are forms of income annuitization; the choice is mainly about when you need the paycheck to start.
Is an annuity a good idea, or should I just withdraw from my portfolio myself?
It depends on what you’re solving for. Managing your own withdrawals keeps every dollar liquid and available to your heirs, but it leaves you exposed to sequence-of-returns risk and requires you to keep recalculating a safe rate as markets move. An income annuity removes that risk for the portion you annuitize, in exchange for giving up access to that lump sum and any market upside on it. Most people don’t do all one or all the other; they cover essential expenses with guaranteed income (Social Security, a pension, and sometimes a modest annuity) and leave the rest invested for flexibility and growth.
What is a MYGA and how is it different from a bank CD?
A multi-year guaranteed annuity (MYGA) is a fixed annuity that locks in a stated interest rate for a set number of years, similar in concept to a bank CD’s fixed term and rate. The differences: a MYGA is issued by an insurance company and backed by its claims-paying ability rather than FDIC insurance, it typically imposes a surrender charge (a penalty for withdrawing more than a set amount before the term ends), and its earnings are usually tax-deferred until withdrawn, unlike a CD’s interest, which is taxed annually. Compare the guaranteed rate, the surrender schedule, and the issuing carrier’s strength before assuming either product is automatically better.
When do I have to start taking required minimum distributions?
Under current law, you generally must begin required minimum distributions (RMDs) from traditional IRAs, SEP IRAs, SIMPLE IRAs, and most employer retirement plans at age 73, according to the IRS. Your first RMD must be taken by April 1 of the year after you turn 73, and each year after that by December 31. Missing an RMD triggers a 25% excise tax on the amount you should have withdrawn, reduced to 10% if you correct it within two years. Roth IRAs are not subject to RMDs during the original owner’s lifetime.
Does buying an annuity mean I’m investing in the stock market?
Not with a fixed or fixed indexed annuity. A fixed annuity credits a set interest rate and doesn’t touch the market at all. A fixed indexed annuity credits interest based in part on the performance of a market index, but your principal isn’t directly invested in that index, and gains are limited by a cap rate or participation rate the insurer sets, while a floor (often 0%) limits how much you can lose in a down year. Fixed indexed annuities are not a market investment and should never be described as one; they trade some upside for principal protection, and they typically carry surrender charges if you withdraw more than allowed during the surrender period.
Before you sign anything
This article is general education, not insurance, legal, financial, or tax advice. Product availability, features, and rates vary by carrier and state and are subject to underwriting. No coverage exists until a policy is issued and in force. Any guarantees, including annuity income guarantees, are subject to the claims-paying ability of the issuing insurer. Please review actual policy and contract documents and speak with a licensed agent about your situation.
Sources
- LIMRA — Final U.S. Retail Annuity Sales Set New Sales High, Totaling $464.1 Billion in 2025 — published March 23, 2026; 2025 sales data
- Morningstar — What’s a Safe Retirement Withdrawal Rate for 2026? — published December 3, 2025, by Amy C. Arnott, Christine Benz, and Jason Kephart
- EBRI — New EBRI Research Finds Guaranteed Income Streams May Help Retirees Preserve Assets Later in Retirement — published May 15, 2026; data from the Health and Retirement Study, 1992–2022
- Social Security Administration — 2026 Cost-of-Living Adjustment (COLA) Fact Sheet — 2.8% COLA effective January 2026
- Social Security Administration, Office of the Chief Actuary — Actuarial Life Table — remaining life expectancy at age 65, 2023 mortality data as used in the 2026 Trustees Report
- Internal Revenue Service — Retirement Topics: Required Minimum Distributions (RMDs) — RMD age and excise tax penalty, current law
- South Dakota Division of Insurance — Annuity Best Interest Standards — effective January 1, 2023
Related reading: Life Insurance Cost by Age: 30, 40 and 50 in 2026 and Final Expense Planning in 2026: Rising Funeral Costs in South Dakota. See current options for fixed annuities, fixed indexed annuities, immediate income annuities, and multi-year guaranteed annuities, or learn more about planning for seniors.